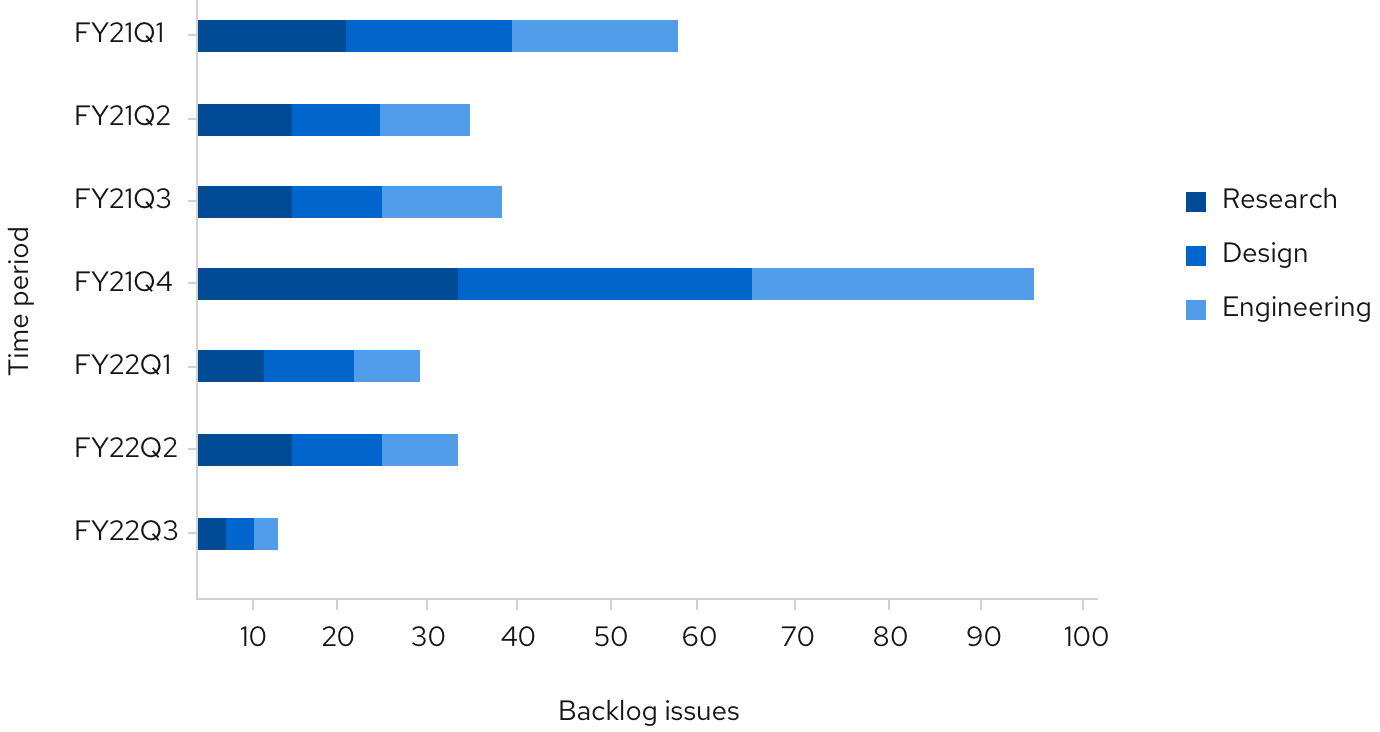
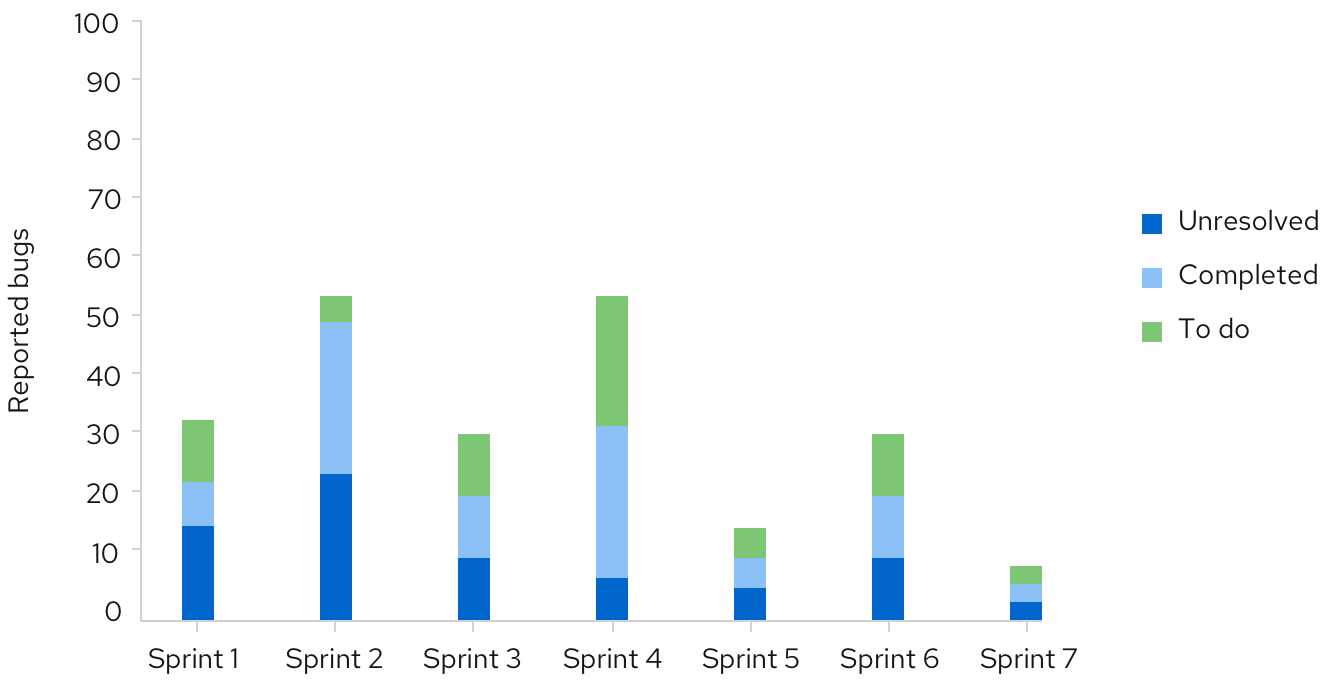
A stacked bar chart describes totals while allowing a degree of internal breakdown of its data. Stacked bar charts can be illustrated vertically and horizontally depending on available space and the described data.
Usage
An advantageous feature of stacked bar charts is the ability to reorder the stacked bars without changing the chart's overall total.
Example


The first series name is represented by the topmost stacked bar, and the last series name is represented by the bottommost stacked bar. For recommendations on series colors, see colors for charts.
View source on GitHub


